Statistical Sample Quotas Using Clustering Model
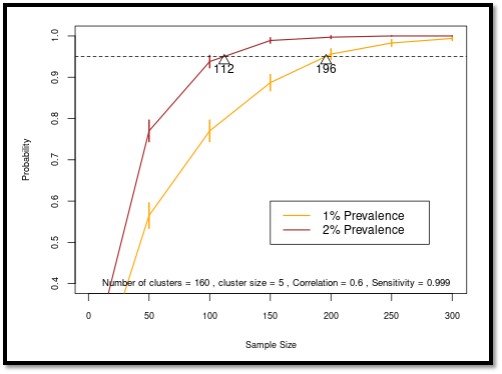
The Statistical Sample Quotas Using Clustering Model estimates the sample size needed for each sub-administrative area with no positive cases to assert with high probability that CWD prevalence in the population is at or below a threshold. The model explicitly accounts for increased disease transmission through the natural clustering behavior of hosts in the population and assumes a simple random sampling design.
Geographical Scale
- Administrative area, subdivided into a sub-administrative areas
Required Data
- Population size or population density of hosts in each sub-administrative area
User Inputs
- Average cluster size of hosts
- Correlation in disease status among hosts sharing a cluster
- Sensitivity of the diagnostic test used to declare a CWD-positive case
Outputs
- The number of randomly selected hosts that need to be tested in each sub-administrative area to have high probability (95%) that the prevalence of CWD in the overall population is at or below 0.5%, 1%, 1.5%, 2%, 3%, 4%, or 5%.
More Information
For more information, go to the CWD Data Warehouse User Manual: Statistical Sample Quotas Using Clustering Model.
Code and Docker Image
To view the code once deployed, go to the GitHub Repository: Statistical Sample Quotas Using Clustering Model. To view the docker image, go to the Docker Hub: cwhl/statistical-sample-size-with-clustering-model.
Citations
- Booth JG, Hanley BJ, Hodel FH, Jennelle CS, Guinness J, Them CE, Mitchell CI, Ahmed MS, Schuler KL. 2024. Sample size for estimating disease prevalence in free-ranging wildlife populations: A Bayesian modeling approach. Journal of Agricultural, Biological, and Environmental Sciences. 29, 438b