Sample Allocation Model
The Sample Allocation Model (SAM) uses optimal control theory to identify an optimal surveillance strategy for areas with no cases of CWD, balancing surveillance costs and the probability of CWD introduction into each area. The SAM framework provides three model settings that allow users to flexibly integrate the probability of disease spread with any historical sampling data and/or expense data to understand (1) the probability that any given area is disease-free at present, and (2) how to best allocate a surveillance budget to be able to identify the introduction of CWD as early as possible.
Geographical Scale
- Administrative area (i.e. agency or state), subdivided into a sub-administrative areas or management units.
Required Data
- The ability to run the Risk-Weighted Surveillance Quotas Model to obtain introduction probabilities
User Inputs
- Annual budget of the surveillance program across the entire administrative area or agency
- Annual growth rate
- Number of years of historical data to include
- Average surveillance cost per-sample in each sub-administrative area
- Maximum sampling capacity in each sub-administrative area
Outputs
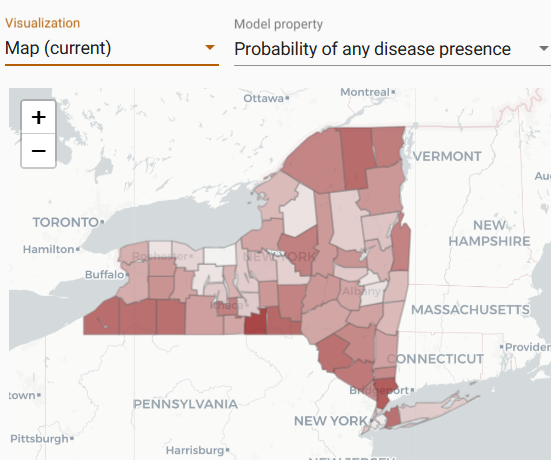
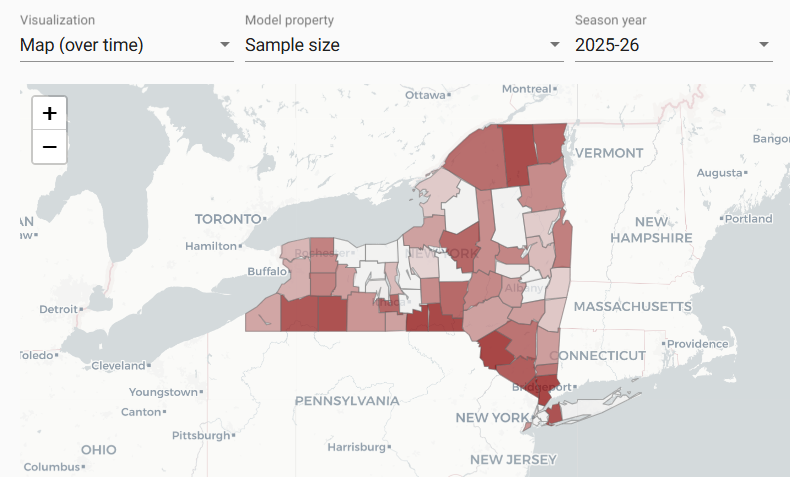
- Choropleth maps showing the current probability and probability over time that each sub-administrative area has CWD present or at a certain level of prevalence
- Choropleth maps showing the intensity of sampling needed over time in each sub-administrative area to achieve optimal control
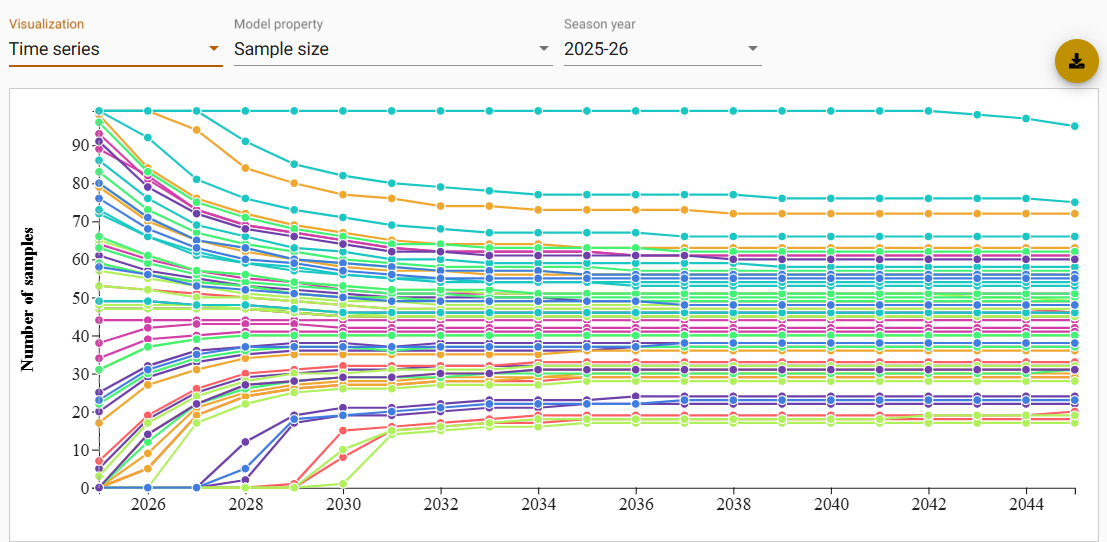
- Time series line graphs showing mock probabilities and sampling plans over time in each sub-administrative area
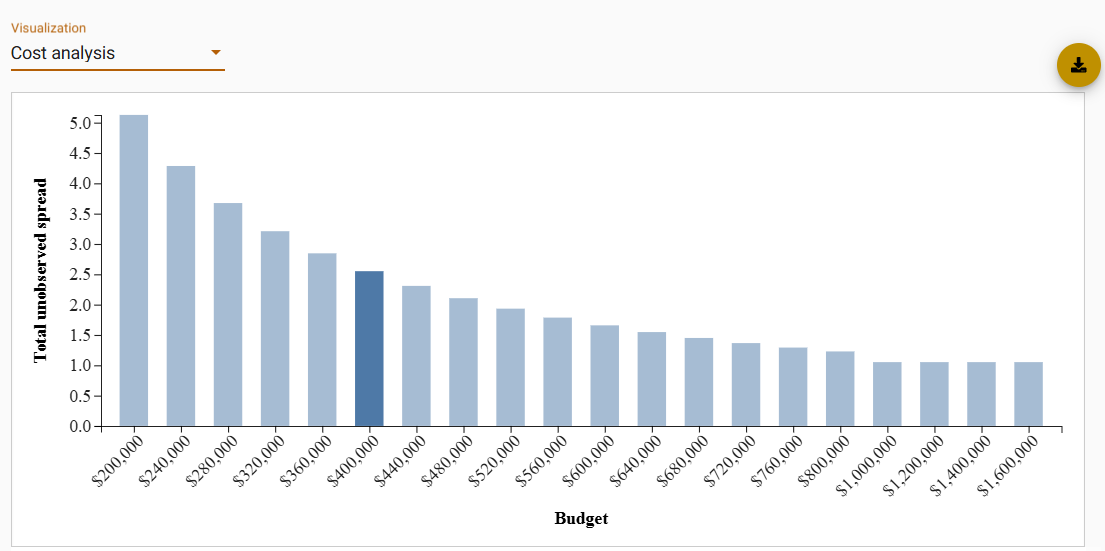
- A bar graph showing how optimal strategies on different annual budgets impact the total delayed time between introduction and detection
More Information
For more information, go to the CWD Data Warehouse User Manual: Sample Allocation Model.
Code
To view the code once deployed, go to the GitHub Repository: Sample Allocation Model.
Citation
- Wang J, Hanley B, Thompson N, Gong Y, Walsh D, Gonzalez-Crespo C, Huang Y, Booth J, Caudell J, Miller L, Schuler K. 2025. Strategic planning of prevention and surveillance for emerging diseases and invasive species. PNAS.