Risk-Weighted Surveillance Quotas Model
Deployed
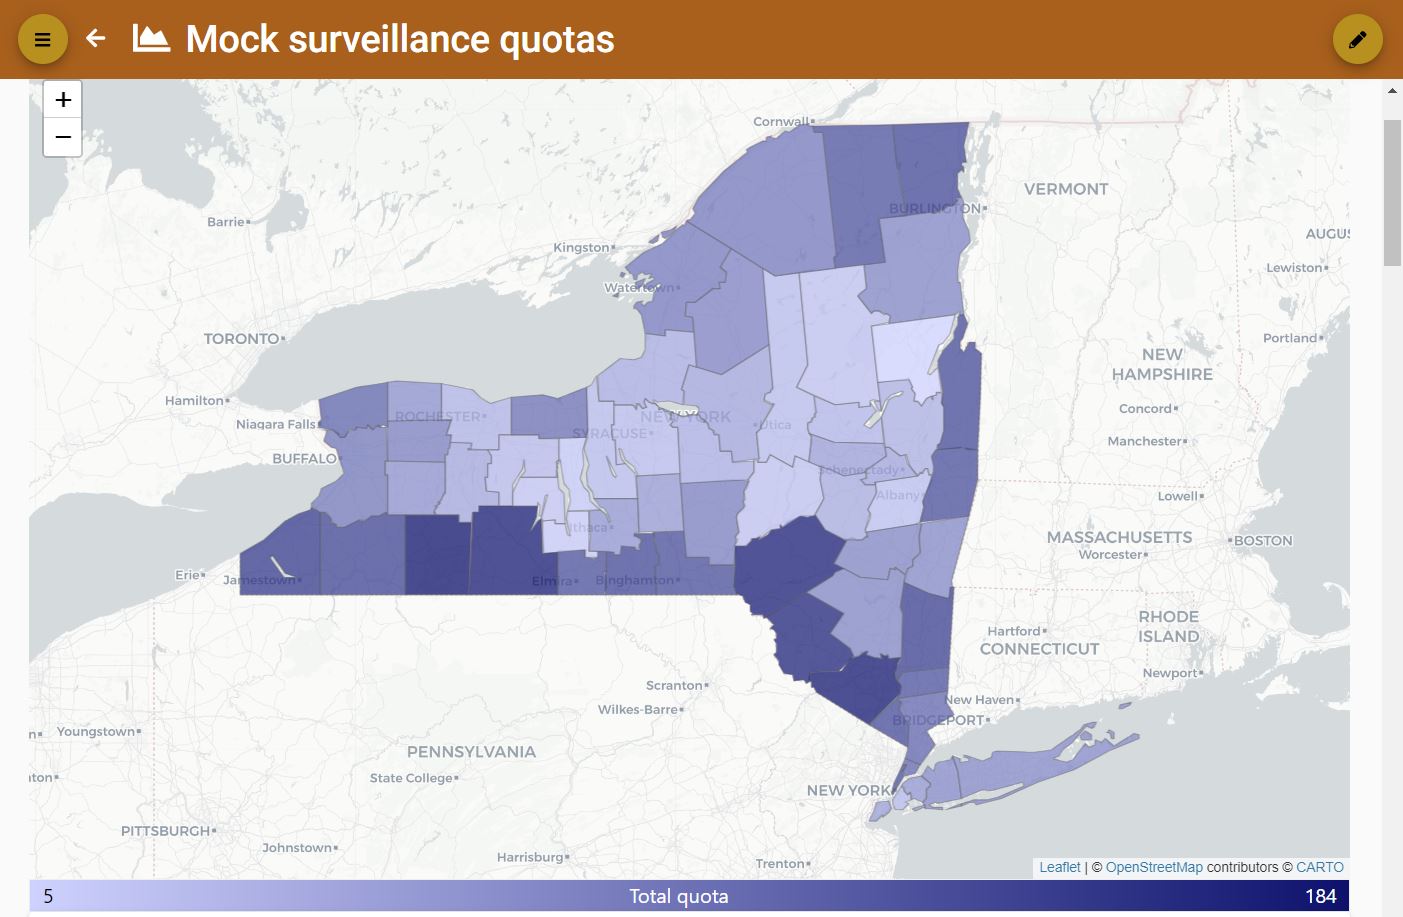
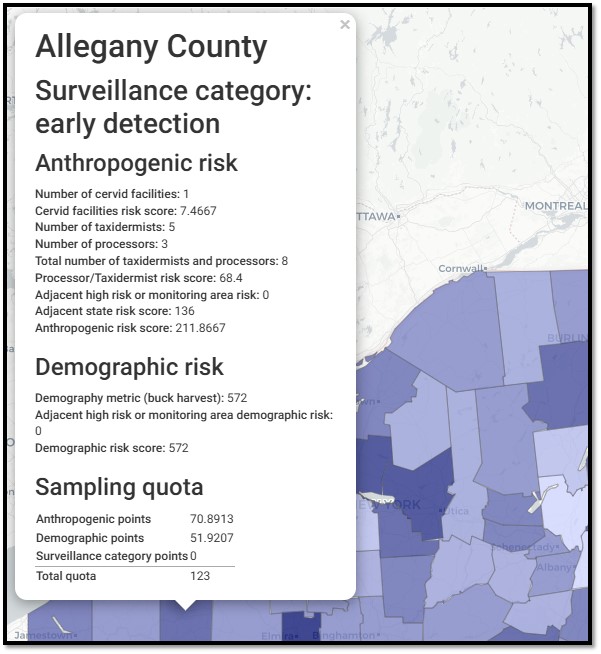
The Risk-Weighted Surveillance Quotas Model incorporates risk factors for CWD, including anthropogenic (human-related) and demographic (host population) forces to calculate surveillance quotas per sub-administrative area. Surveillance targets can be used by agencies to plan upcoming surveillance across a region, state, province, or nation.
Geographical Scale
- Administrative area, subdivided into a sub-administrative areas
Required Data
- Deer demography data
Suggested Data
- Cervid facility data
- Taxidermist data
- Meat processor data
User Inputs
- The number of surveillance points achievable for the entire administrative area
- Surveillance categories for each sub-administrative area
Outputs
- Surveillance quotas by sub-administrative area
- Comparative maps of quotas by surveillance category
- Risk profiles of each sub-administrative area
- Charts and comparative tables of quotas and risks
More Information
For more information, go to the CWD Data Warehouse User Manual: Risk-Weighted Surveillance Quotas Model.
Code
To view the code, go to the GitHub Repository: Risk-Weighted Surveillance Quotas Model.
Citation
- Schuler KL, Hollingshead NA, Heerkens S, Kelly JD, Hurst JE, Abbott RC, Hanley BJ, Collins E, Hynes KP. A "hazard model" using risk-weighted surveillance for first detection of chronic wasting disease. Preventive Veterinary Medicine.